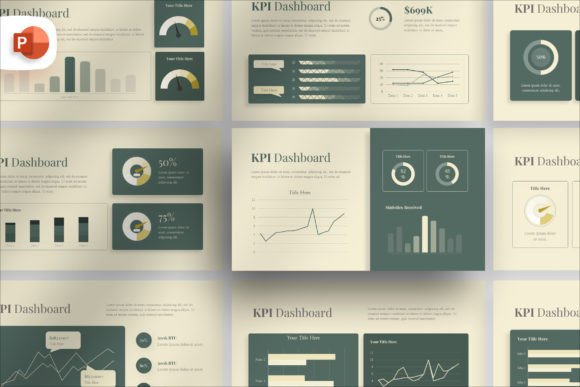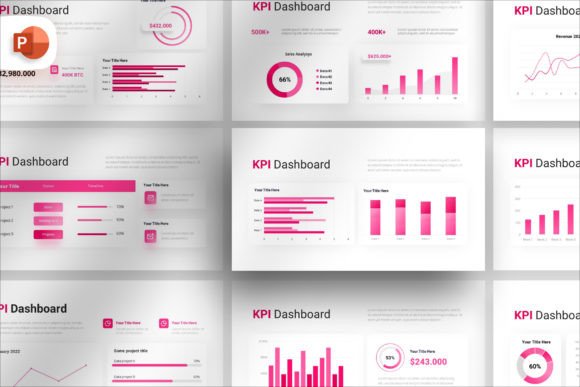
Company KPI Dashboard PowerPoint: A Practical Guide to Better Presentations
In the fast-paced world of business, education, and strategy, the ability to convey complex data clearly is not just a skill—it is a necessity. When stakeholders need to understand performance metrics instantly, a cluttered or confusing slide deck can derail even the most brilliant strategy. This is where a Company KPI Dashboard PowerPoint becomes an essential tool. It is designed to transform raw numbers into visually stunning graphics that tell a compelling story. However, simply downloading a template is not enough; knowing how to select and use one correctly makes all the difference between a presentation that captivates and one that confuses.
Why Visualizing Metrics Matters
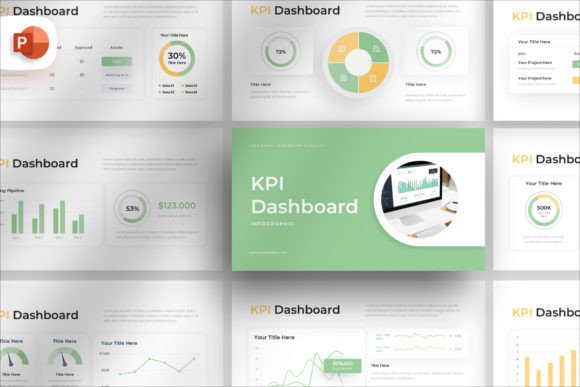
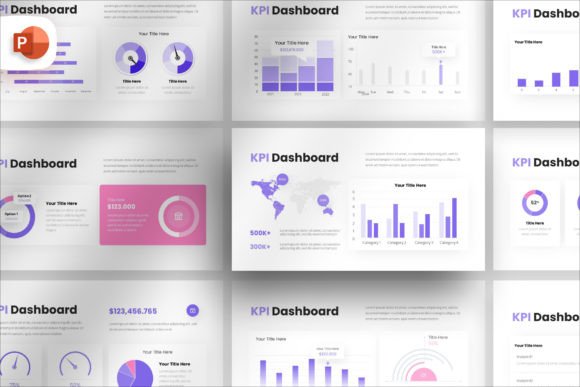
The primary reason professionals seek out a Company KPI Dashboard PowerPoint is to bridge the gap between data analysis and decision-making. Whether you are a small business owner tracking monthly revenue, an educator explaining project milestones, or a marketer presenting campaign ROI, your audience needs clarity. These templates provide pre-designed flowcharts, charts, and graphs that allow you to effortlessly convey ideas, processes, and strategies. The goal is to create impactful, professional presentations that do the heavy lifting for you, ensuring that the focus remains on the message rather than the mechanics of design.
Yet, many users approach these tools with a "set it and forget it" mentality, assuming that the template alone guarantees success. This is a common misunderstanding. A template is a framework, not a magic wand. If the underlying data is messy or the visual hierarchy is ignored, the result will still be ineffective. To truly revolutionize your presentations, you must understand both the power of the tool and the pitfalls of improper usage.
Common Mistakes When Choosing a Dashboard Template
Before you download any resource, it is crucial to evaluate what you are actually getting. One of the most frequent errors beginners make is ignoring the technical specifications. Many free or low-quality templates claim to be versatile but fail when opened in newer versions of software or on different devices. Always check the aspect ratio. Modern screens and projectors predominantly use a 16:9 widescreen format. If you choose a template stuck in the old 4:3 standard, your slides will appear cropped or stretched, ruining the professional look you are trying to achieve.
Another overlooked detail is the licensing and asset inclusion. Some templates promise a complete package but exclude critical image stocks or fonts. You might find yourself scrambling to replace generic placeholders only to discover that the font used in the document folder is not free for commercial use. This can lead to legal issues or a last-minute redesign that costs more time than creating a slide from scratch. Always verify that the license is clear and that all necessary assets are included or easily accessible.
The Trap of Over-Editing and Under-Utilizing Features
Once you have selected a high-quality Company KPI Dashboard PowerPoint, the next phase involves customization. Here, two opposite mistakes often occur. On one hand, some users try to change everything—the colors, the shapes, the layout—until the original design integrity is lost. While the template should be fully editable regarding shape color, size, and position, drastic changes can break the visual balance intended by the designer. The result is often a disjointed slide deck that lacks cohesion.
On the other hand, many users under-utilize the advanced features built into modern templates. For instance, many premium dashboards come with drag-and-drop picture placeholders that auto-adjust size, transparency, and shape. Ignoring these features and manually resizing images leads to pixelated photos and inconsistent spacing. Similarly, failing to use the included mockup devices means missing a powerful way to showcase your digital products or apps. Simply dragging and dropping your screen placeholder into the provided device frame can instantly elevate the perceived value of your proposal.
How Poor Choices Impact Your Results
The consequences of these mistakes extend beyond aesthetics. In a business context, a poorly executed presentation can undermine your credibility. If your KPIs are hard to read due to bad formatting, stakeholders may question the accuracy of the data itself. In education, a confusing flowchart can hinder student understanding of complex processes. Efficiency also takes a hit; spending hours fixing broken layouts or hunting for missing fonts detracts from the time you should spend refining your content.
Furthermore, cost implications are real. Time spent correcting a subpar template is money lost. If you are a freelancer or entrepreneur, every hour counts. A template that requires constant tweaking because it lacks easy editing capabilities effectively increases your labor costs. Conversely, investing in a well-structured, fully editable template with documentation files ensures that you can adapt quickly to changing requirements without starting over.
Practical Steps for Success
To avoid these pitfalls, adopt a checklist approach before and during your use of a Company KPI Dashboard PowerPoint. First, confirm the file compatibility and aspect ratio. Ensure it supports the 16:9 standard and opens smoothly on your version of PowerPoint. Second, review the documentation file. A good template comes with instructions on how to edit text, change colors, and insert images. Read this guide to understand the specific mechanics of the drag-and-drop features.
When customizing, resist the urge to reinvent the wheel. Use the pre-set color palettes unless you have a strong branding reason to change them. Leverage the auto-adjustment features for images to maintain consistency across all 21 unique slides. If the template includes mockup devices, use them to visualize your data in a real-world context. This adds a layer of professionalism that static charts cannot match.
Evaluating Quality Before Downloading
Not all templates are created equal. When comparing options, look for versatility. A robust dashboard should serve multiple purposes, from business reports to educational workshops. Check if the design allows for seamless communication of complex ideas through clear flowcharts and structured layouts. Pay attention to the number of slides; a comprehensive set like the 21 unique slides offered in high-end packages provides enough variety to cover different sections of a presentation without repetition.
Also, consider the support and resources available. Does the package include a documentation file? Are there examples of how to use the features? These indicators suggest a product that has been thoughtfully designed for user success. Remember, the best tool is one that empowers you to focus on your message, not the mechanics of the slide deck.
Final Thoughts on Effective Communication
A Company KPI Dashboard PowerPoint is more than just a collection of slides; it is a strategic asset for anyone looking to communicate with impact. By avoiding common traps like ignoring aspect ratios, overlooking licensing details, or misusing editing features, you ensure that your presentation serves its purpose effectively. The right template, used correctly, allows you to effortlessly convey ideas and strategies with confidence. Take the time to choose wisely, customize thoughtfully, and let your data speak clearly. Your audience will notice the difference, and your professional reputation will benefit from the clarity and polish you bring to every meeting.